
The Rounds of Drafting: Part 1
Drafting is, perhaps, the single most important aspect of team building in the league. Knowing how to use your picks to the most effective use is imperative to building a team’s success. In this multi-part series, we look at drafting by the numbers – what a GM can expect to find when they are picking, the best and worst picks ever, and which teams are the best and worst at drafting in total.
We start today by looking at the expected performance of a draft pick – basically, if you’re a GM, what should you expect from your first overall pick? What should you expect from your third round pick?
It should come to no surprise that there is a steep drop off from the first four picks. Those are almost always the safest, top performing players out of every draft. It’s hard to mess those picks up, but it has been done before.
It’s here that we introduce you to xWAR. Might we have just put “x” at the front of it to make it sound more official?
Yes, yes we did.
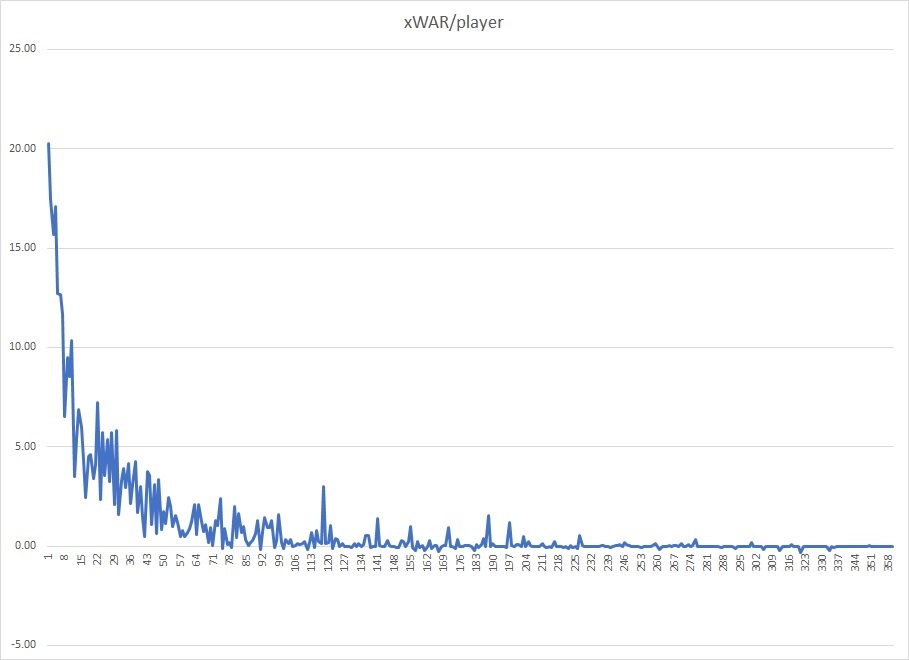
But it also quantifies something about what to expect from a player picked at a specific point in the draft. The first overall pick is expected to produce just over 20 WAR over his career. A late round pick is expected to put up nothing. The random spikes you see after the third round are often players that performed better than anybody thought – think of the Matt Petersons and Danny Acostas of the world. Teams can’t expect that kind of contribution from their late (6th round and later) guys, so we’ll be focusing in on the first through fourth rounds for most of our time here.
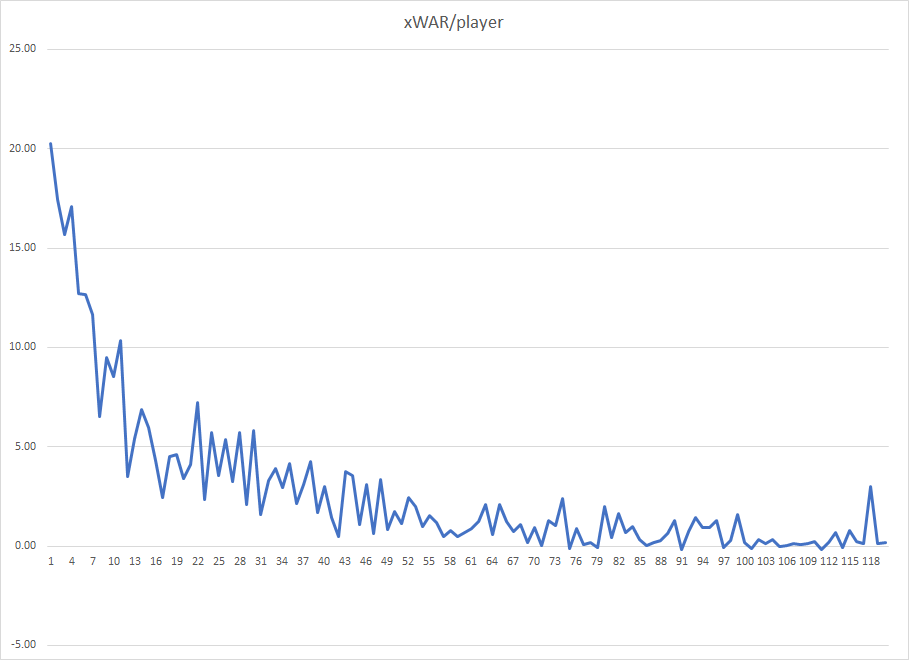
Blowing up the graph tells us an even clearer story – there’s a steep drop off from the 11th pick on, with fairly low expectations from there on out. In one pick, the expected contribution drops from 11 WAR to an average of 4.5 WAR for the rest of the first round. If you’re getting contributions from your second round player, you’re above average – between the second and third round, a 5 WAR player beats the average every time.
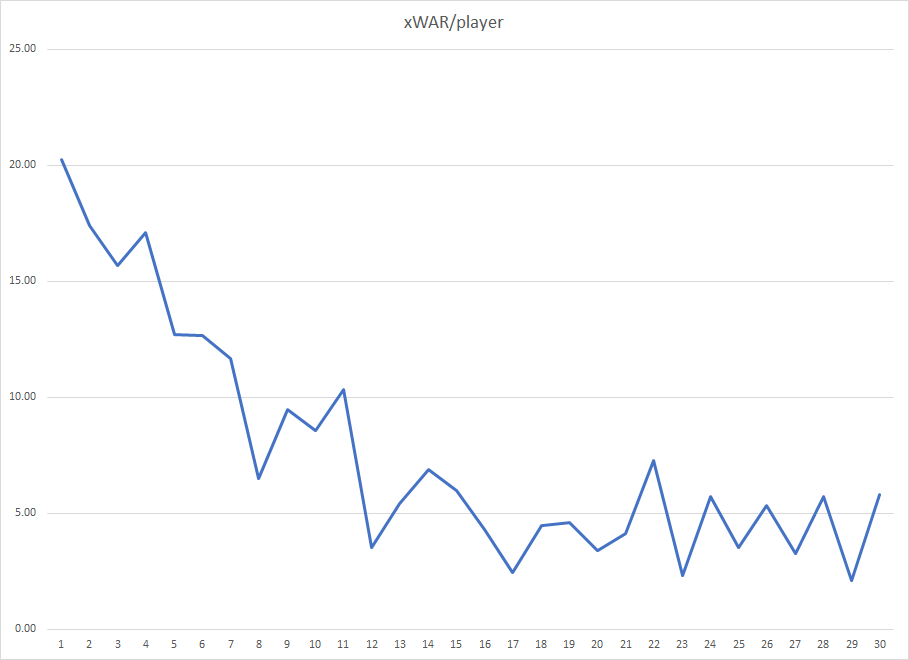
Blowing up the first round also shows us the general trend – if you’re picking 11th or higher, expect a 10 WAR player. If not, 5 WAR is an average result. This is what sets the great teams apart – if you can continually find talent past the 11th overall pick, you’re on track for success. We’ll get into those teams later.
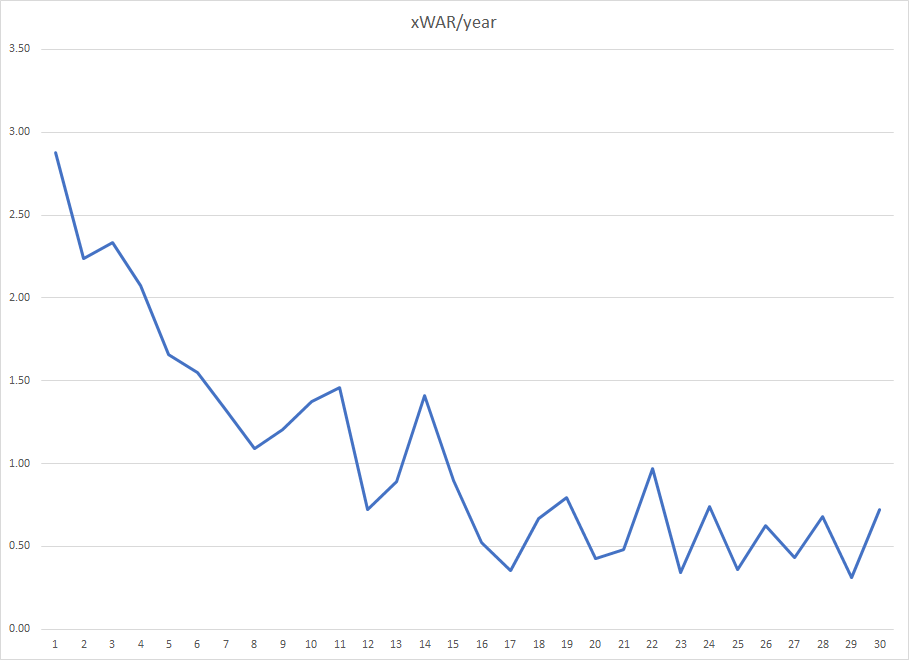
xWAR/year
So we’ve seen what xWAR/player has – but what does xWAR/year add to our discussion?
xWAR/player doesn’t count for time spent in the league – so, picks that have a longer history have a higher impact. xWAR/year doesn’t grant players the additional benefit of letting history play out – but that also allows players who have been picked in more recent drafts to have a higher impact on the statistics.
Taking a look at the first graph…

The graph still has a giant hockey stick portion – but look at the rate at which it’s going down. We’re not going down by 5 WAR over a career, but by 0.5 WAR per season. You might say that the graphs are similar, and they are – but I’d venture to say that, looking at it by year instead of by career, the effect of picking later has been minimized. Perhaps the first few years GMs didn’t know how to look for targets later in drafts, but now, with experience, the gap between the first 11 picks and the rest has been minimized.

Looking at rounds 1-4 we have higher peaks and sharper valleys. Again, however, after the 11th pick players aren’t expected to contribute more than 1 WAR per year.
This number may seem low to you, and it is. This doesn’t count the fact that prospects who haven’t reached the majors yet still show up at 0 WAR – though, in another part, we will address this.
Adjusting the first round, though, the decline doesn’t seem quite as evident as the xWAR/year chart – while there is certainly decline, it doesn’t look as evident as the career graph.
Give us some time, say the late first round picks, and we’ll contribute. We just need time.